This product was not featured by Product Hunt yet. It will not be visible on their landing page and won't be ranked (cannot win product of the day regardless of upvotes).
Real-time Financial Dashboard
Track markets and spending, rebuilt from my 2020 MSc thesis
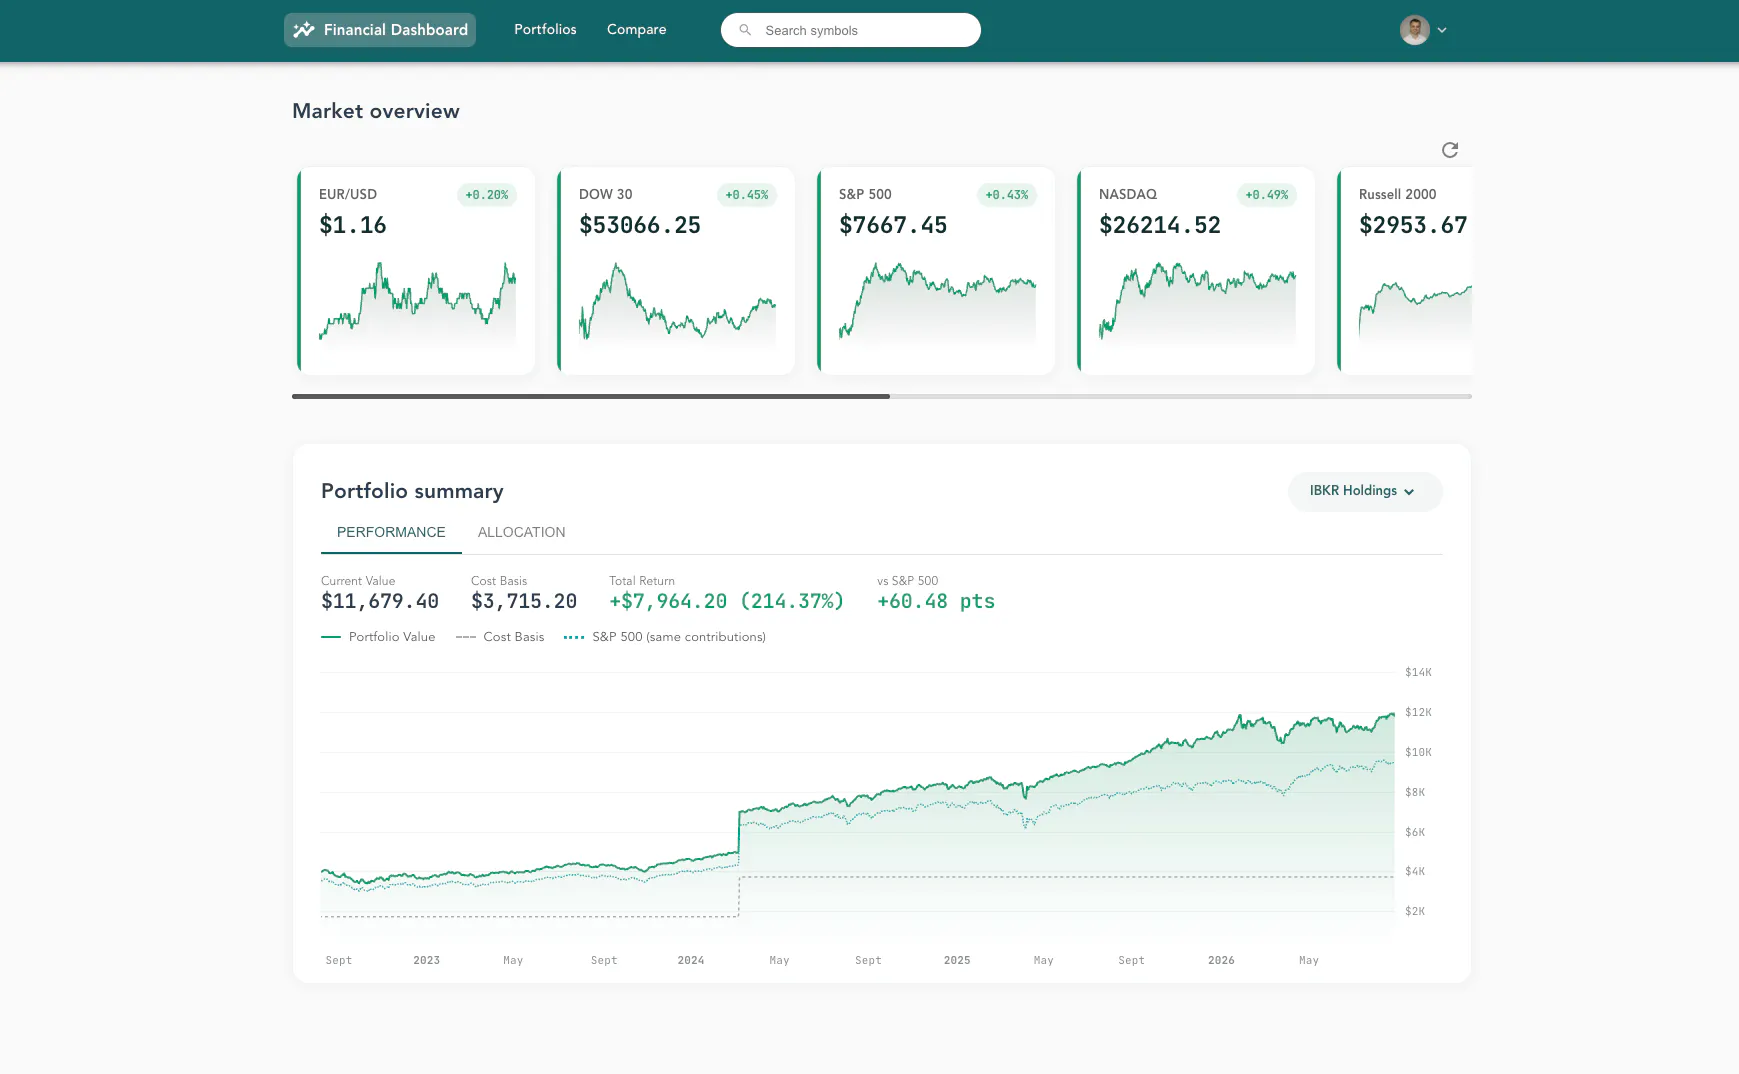
A fintech dashboard that started as my master's thesis in 2020 and is now a real, deployed project. Track market data and visualize your own spending with full control over your data, no third-party fintech app required. Backend: Flask + PostgreSQL for core data, Redis for caching and sessions. Aggregates prices from multiple providers (yfinance, Alpha Vantage, IEX) with automatic fallback for reliability. Frontend: Vue.js / Vuex. Built solo end to end. Open source.
Hey Product Hunt 👋
Back in 2020 I built this as my master's thesis. The goal was mainly academic - I wanted to build a real full-stack app, not just a backend exercise, and I wanted to work with multiple external data sources instead of one clean API. It sat mostly untouched for years while I worked as a backend engineer (Django, FastAPI, Flask) at a few different companies.
This year I revived it (Using only free resources): moved the deploy target to Render, Neon (DB), and Upstash (Redis), cleaned up the data layer, and got it running live again at finance.puljic.ch.
A few things I'm proud of under the hood:
Market data aggregated across multiple providers (yfinance, Alpha Vantage, IEX) with automatic fallback, so one provider going down doesn't take the dashboard with it.
Redis for caching and session handling, cutting redundant calls to external APIs.
PostgreSQL as the single source of truth, simplified from an earlier version which also used MongoDB.
It's fully open source (MIT) — code's linked above. Would love feedback, especially from anyone who's dug up an old project of their own, or has thoughts on the backend architecture.
No comment highlights available yet. Please check back later!
About Real-time Financial Dashboard on Product Hunt
“Track markets and spending, rebuilt from my 2020 MSc thesis”
Real-time Financial Dashboard was submitted on Product Hunt and earned 2 upvotes and 1 comments, placing #121 on the daily leaderboard. A fintech dashboard that started as my master's thesis in 2020 and is now a real, deployed project. Track market data and visualize your own spending with full control over your data, no third-party fintech app required. Backend: Flask + PostgreSQL for core data, Redis for caching and sessions. Aggregates prices from multiple providers (yfinance, Alpha Vantage, IEX) with automatic fallback for reliability. Frontend: Vue.js / Vuex. Built solo end to end. Open source.
Real-time Financial Dashboard was featured in Open Source (69k followers), Fintech (47.7k followers), Developer Tools (521.8k followers) and GitHub (41.4k followers) on Product Hunt. Together, these topics include over 161.2k products, making this a competitive space to launch in.
Who hunted Real-time Financial Dashboard?
Real-time Financial Dashboard was hunted by Domagoj Puljic. A “hunter” on Product Hunt is the community member who submits a product to the platform — uploading the images, the link, and tagging the makers behind it. Hunters typically write the first comment explaining why a product is worth attention, and their followers are notified the moment they post. Around 79% of featured launches on Product Hunt are self-hunted by their makers, but a well-known hunter still acts as a signal of quality to the rest of the community. See the full all-time top hunters leaderboard to discover who is shaping the Product Hunt ecosystem.
Want to see how Real-time Financial Dashboard stacked up against nearby launches in real time? Check out the live launch dashboard for upvote speed charts, proximity comparisons, and more analytics.

 Domagoj Puljic