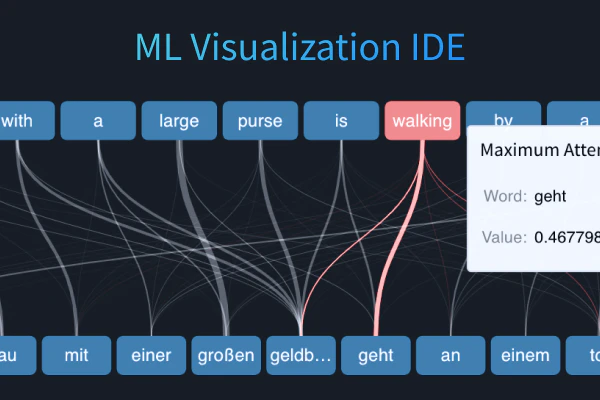
Debug your machine learning models in realtime with powerful, interactive visualizations. Quickly log charts from your Python script, visualize your model development in live dashboards, and share interactive plots with your team, in just 2 minutes.
ML Visualization IDE launched on Product Hunt on October 14th, 2020 and earned 88 upvotes and 2 comments, placing #17 on the daily leaderboard. Debug your machine learning models in realtime with powerful, interactive visualizations. Quickly log charts from your Python script, visualize your model development in live dashboards, and share interactive plots with your team, in just 2 minutes.
ML Visualization IDE was featured in Developer Tools (515.7k followers), Artificial Intelligence (473.5k followers) and Tech (627.8k followers) on Product Hunt. Together, these topics include over 347.9k products, making this a competitive space to launch in.
Who hunted ML Visualization IDE?
ML Visualization IDE was hunted by Carey Phelps. A “hunter” on Product Hunt is the community member who submits a product to the platform — uploading the images, the link, and tagging the makers behind it. Hunters typically write the first comment explaining why a product is worth attention, and their followers are notified the moment they post. Around 79% of featured launches on Product Hunt are self-hunted by their makers, but a well-known hunter still acts as a signal of quality to the rest of the community. See the full all-time top hunters leaderboard to discover who is shaping the Product Hunt ecosystem.
Want to see how ML Visualization IDE stacked up against nearby launches in real time? Check out the live launch dashboard for upvote speed charts, proximity comparisons, and more analytics.
 Carey Phelps