This product was not featured by Product Hunt yet. It will not be visible on their landing page and won't be ranked (cannot win product of the day regardless of upvotes).
丝绸之路 · 交互知识图谱
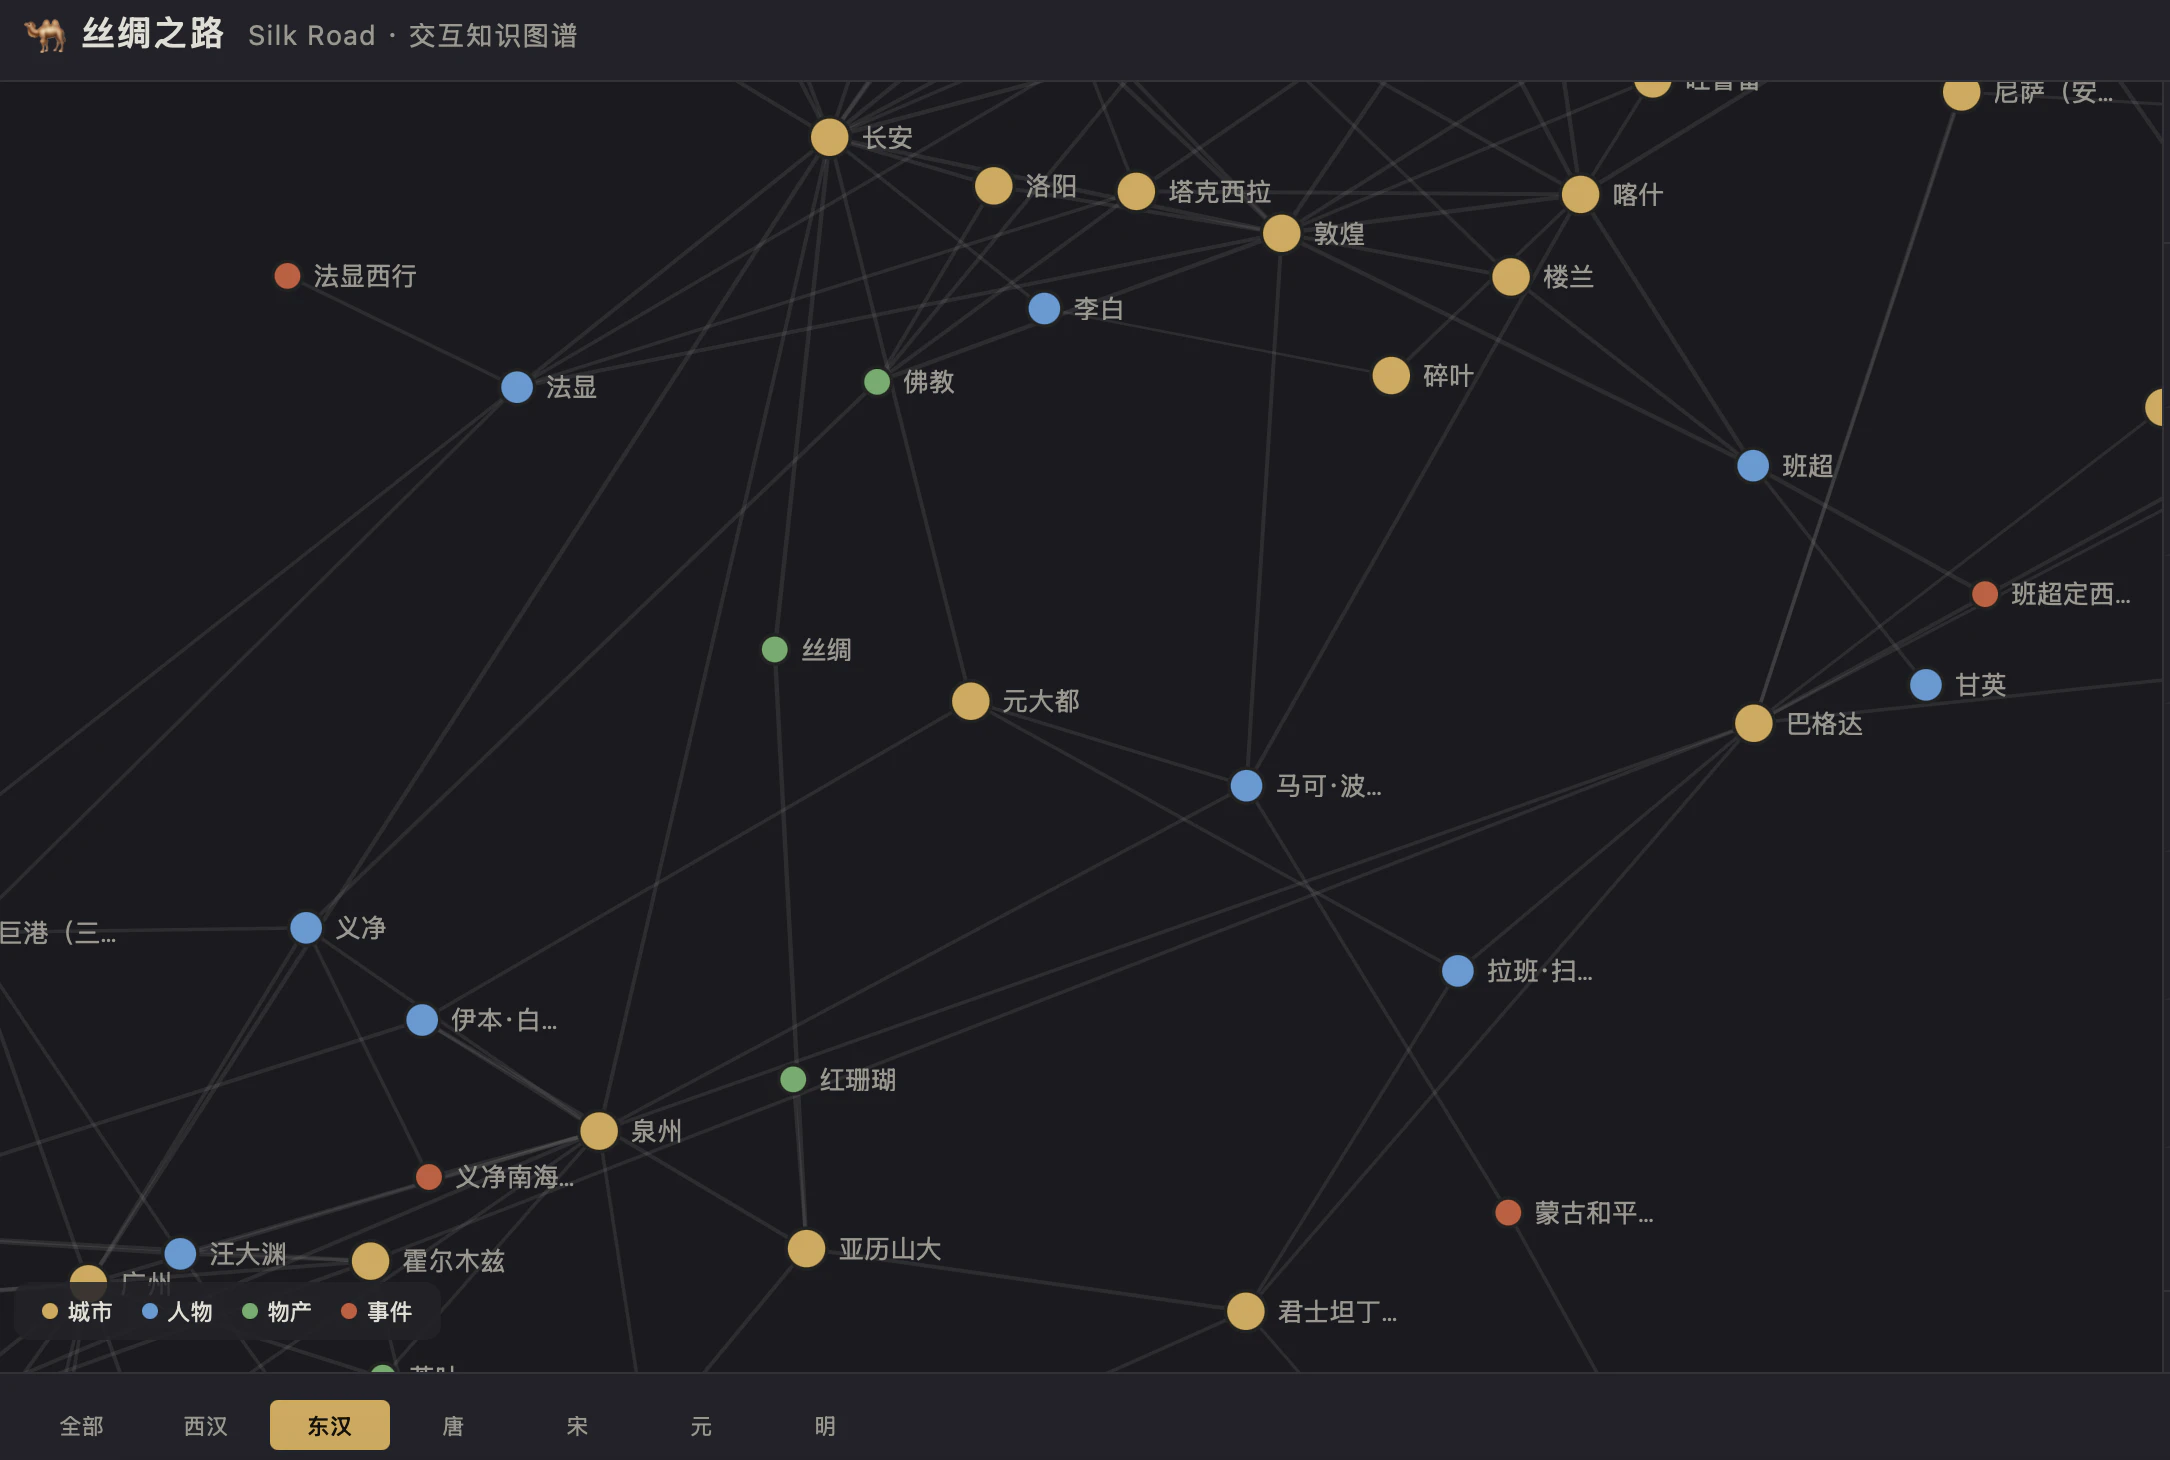
Interactive knowledge graph of the ancient Silk Road
Explore 2,000 years of East-West exchange in one interactive graph. 32 cities on real coordinates, 21 historical figures, 22 trade goods, 16 events — all connected through 211 relationship edges. 8 animated routes show how silk, paper, gunpowder and Buddhism traveled across continents. Built with Leaflet.js + D3.js v7 + Canvas. Dual-language Chinese/English. All data CC BY-SA 4.0, code MIT — fully open-source.
I visited Dunhuang and stood in front of the Mogao Caves. On thousand-year-old murals, merchants from Persia, monks from India, envoys from Rome — all met in one cave because of one road.
When I came back, I found the knowledge scattered across dozens of Wikipedia pages. To trace how papermaking reached Europe, I needed 5 different tabs.
So I built this. One JSON file. 211 relationships. Everything connected into a living knowledge graph. Add one piece of data, and the map, timeline, and graph all update automatically.
The best part: route animations. Pick a route, and watch a golden dot travel from Chang'an to Europe, with narration via Web Speech API. 8 routes, ~4 minutes, zero editing software.
Zero-framework, pure vanilla JS. All data and code open-source.
Would love your feedback! 🐫
No comment highlights available yet. Please check back later!
About 丝绸之路 · 交互知识图谱 on Product Hunt
“Interactive knowledge graph of the ancient Silk Road”
丝绸之路 · 交互知识图谱 was submitted on Product Hunt and earned 0 upvotes and 1 comments, placing #107 on the daily leaderboard. Explore 2,000 years of East-West exchange in one interactive graph. 32 cities on real coordinates, 21 historical figures, 22 trade goods, 16 events — all connected through 211 relationship edges. 8 animated routes show how silk, paper, gunpowder and Buddhism traveled across continents. Built with Leaflet.js + D3.js v7 + Canvas. Dual-language Chinese/English. All data CC BY-SA 4.0, code MIT — fully open-source.
丝绸之路 · 交互知识图谱 was featured in Open Source (68.6k followers), Education (78.8k followers), GitHub (41.3k followers) and Data Visualization (3.6k followers) on Product Hunt. Together, these topics include over 69.1k products, making this a competitive space to launch in.
Who hunted 丝绸之路 · 交互知识图谱?
丝绸之路 · 交互知识图谱 was hunted by Silk Road Knowledge Graph. A “hunter” on Product Hunt is the community member who submits a product to the platform — uploading the images, the link, and tagging the makers behind it. Hunters typically write the first comment explaining why a product is worth attention, and their followers are notified the moment they post. Around 79% of featured launches on Product Hunt are self-hunted by their makers, but a well-known hunter still acts as a signal of quality to the rest of the community. See the full all-time top hunters leaderboard to discover who is shaping the Product Hunt ecosystem.
Want to see how 丝绸之路 · 交互知识图谱 stacked up against nearby launches in real time? Check out the live launch dashboard for upvote speed charts, proximity comparisons, and more analytics.
 Silk Road Knowledge Graph