This product was not featured by Product Hunt yet. It will not be visible on their landing page and won't be ranked (cannot win product of the day regardless of upvotes).
Product upvotes vs the next 3
Waiting for data. Loading
Product comments vs the next 3
Waiting for data. Loading
Product upvote speed vs the next 3
Waiting for data. Loading
Product upvotes and comments
Waiting for data. Loading
Product vs the next 3
Loading
Charttoolbox
Turn spreadsheet data into clear charts in your browser
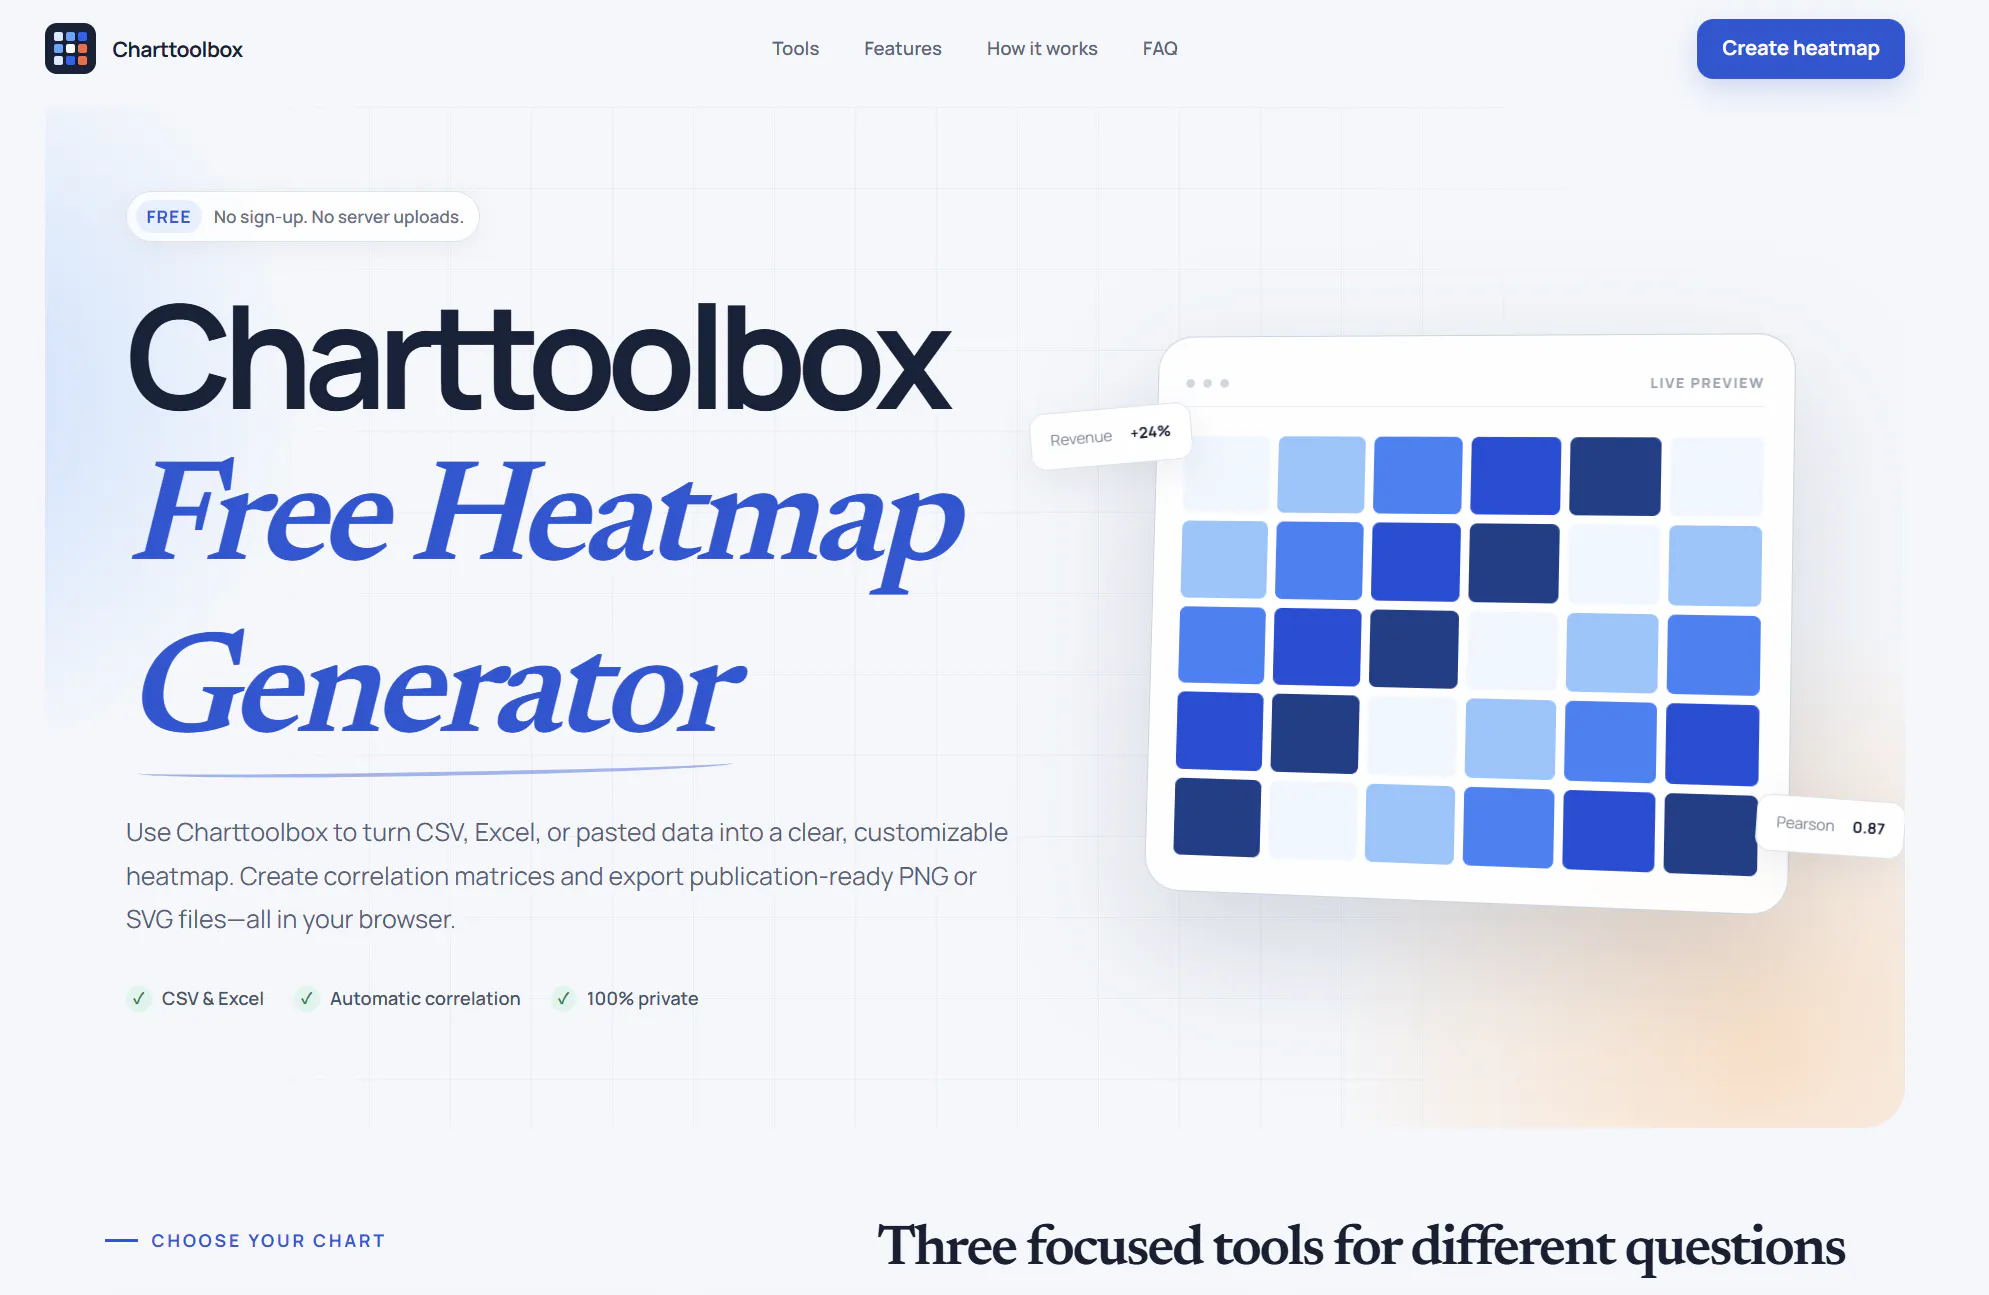
Create heatmaps, pie and donut charts, or bar charts from CSV, Excel, and pasted data. Review field mapping, customize the result, and export PNG or SVG without uploading spreadsheet contents for server-side chart processing.
Hi Product Hunt — I built Charttoolbox after noticing a gap between spreadsheet charts and full BI tools.
For a small CSV, I often wanted three things: a clear recommendation about the expected data shape, a way to correct automatic field detection, and an export I could continue editing.
The first version focused only on heatmaps. User workflow questions led me to add two separate tools rather than one generic chart picker: pie/donut for genuine part-to-whole data, and bar charts for category or multi-series comparison.
I intentionally left out accounts, cloud storage, collaboration, and AI features. The current product is a focused browser utility: open or paste data, verify the mapping, customize, and export.
I would love feedback from people who work with CSV or Excel: which step still feels unclear, and what kind of small chart task is not covered well?
The demo data is fictional.
## Feature list
- Heatmap, Pie/Donut, and Bar Chart workflows
- CSV, TSV, XLS, XLSX, and pasted table input
- Visible and editable field mapping
- Clear validation instead of silent data repair
- Vertical, horizontal, and grouped bars
- PNG at multiple scales and editable SVG export
- Local spreadsheet-content processing
- No account required
## FAQ
**Does Charttoolbox upload my spreadsheet?**
Spreadsheet contents are parsed and rendered in the browser and are not uploaded for server-side chart creation. Optional GA4 analytics loads only after consent and is not intended to receive file names, cell values, pasted data, or generated chart data.
**Which chart should I choose?**
Use a heatmap for patterns across two dimensions, pie/donut for a small part-to-whole dataset, and bars for category or multi-series comparison.
**Can I edit the detected fields?**
Yes. Heatmap interpretation and pie/bar category-value mappings remain visible and editable.
**What does it export?**
PNG for sharing and SVG for further editing.
**Is this a BI dashboard?**
No. It is intentionally designed for quick, one-off chart creation.
About Charttoolbox on Product Hunt
“Turn spreadsheet data into clear charts in your browser”
Charttoolbox was submitted on Product Hunt and earned 2 upvotes and 1 comments, placing #159 on the daily leaderboard. Create heatmaps, pie and donut charts, or bar charts from CSV, Excel, and pasted data. Review field mapping, customize the result, and export PNG or SVG without uploading spreadsheet contents for server-side chart processing.
On the analytics side, Charttoolbox competes within Design Tools, Analytics and Developer Tools — topics that collectively have 959.6k followers on Product Hunt. The dashboard above tracks how Charttoolbox performed against the three products that launched closest to it on the same day.
Who hunted Charttoolbox?
Charttoolbox was hunted by xin zhang. A “hunter” on Product Hunt is the community member who submits a product to the platform — uploading the images, the link, and tagging the makers behind it. Hunters typically write the first comment explaining why a product is worth attention, and their followers are notified the moment they post. Around 79% of featured launches on Product Hunt are self-hunted by their makers, but a well-known hunter still acts as a signal of quality to the rest of the community. See the full all-time top hunters leaderboard to discover who is shaping the Product Hunt ecosystem.
For a complete overview of Charttoolbox including community comment highlights and product details, visit the product overview.

 xin zhang